Re-balance Cycle Reminder All MyPlanIQ’s newsletters are archived here.
Regular AAC (Asset Allocation Composite), SAA, and TAA portfolios are always rebalanced on the first trading day of a month. the next re-balance will be on Monday, June 3, 2024.
As a reminder to expert users: advanced portfolios are still re-balanced based on their original re-balance schedules and they are not the same as those used in Strategic and Tactical Asset Allocation (SAA and TAA) portfolios of a plan.
Total Return Investments vs. High Yields: Yield Chasing at Your Own Peril
In the world of investing, the allure of high yields can be intoxicating. The promise of consistent, substantial returns is hard to resist, particularly for people like retirees who are seeking income. However, not all yields are created equal, and focusing solely on yield can lead to suboptimal investment outcomes. In this article, we will explore the different types of yields and why total return is a more comprehensive measure of investment success. We’ll also discuss tax implications that investors should consider.
Understanding Different Types of Yields
When it comes to yields, investors often have warm and fuzzy feelings because steady cash distributions provide a sense of income. On the other hand, capital appreciation or price changes in investments are more abstract; after all, prices can change on a whim due to volatile markets. This perception holds true to an extent. However, precisely because of investors’ desire for income, financial companies work hard to create various income investment securities (mostly funds) to boost yields or ‘income’. Let’s first understand different types of yields out there in the markets.
1. Stock (Fund) Yields Stock yields typically refer to the dividend yield, which is the annual dividend payment divided by the stock price. While dividends can provide a steady income stream, high dividend yields can sometimes indicate underlying problems with the company, such as declining stock prices or unsustainable payout ratios.There are many solid companies that have maintained and grown yields over times. Examples include JP Morgan (JPM), Coca-Cola (KO), Apple (AAPL) and Home Depot, However, many companies are forced to cut dividends over times or have to resorted to pay out dividends that caused negative cash flow which can’t sustain. Representative stock ETF funds are like Vanguard Dividend Appreciation ETF VIG or Vanguard High Dividend ETF (VYM). Currently VIG yields 2.1% annually.
2. Bond (Fund) Yields Bond (fund) yields represent the interest income generated by the bonds within the fund. This yield can be appealing, especially when bond prices are stable or rising. However, bond yields can be affected by interest rate changes and credit risks associated with the underlying bonds.
3. Manufactured Yield Type 1: Option-Generated Yields Option strategies, such as covered calls, can generate additional income (yield) from stocks or ETFs. While these yields can enhance returns, they also cap the potential upside and can introduce significant risks, especially in volatile markets. One of the most popular ETFs is JP Morgan Premium Income JEPI that has accumulated over $33 Billion asset under management. The investment strategy of JEPI is that it holds a diversified high conviction stocks and then sells (or called writes) S&P 500 index options to generate extra income. Currently JEPI yields 7.6% annually, way above VIG’s 2.1%!
4. Manufactured Yield Type 2: Leveraged Bond or Stock Fund Yields (e.g., Closed-End Fund Yields) Leveraged funds use borrowed money to amplify returns, which can result in higher yields. However, leverage increases the risk of losses, especially during market downturns. Closed-end funds, in particular, can be subject to significant price volatility and liquidity risks. There are also a lot of leveraged funds that try to deliver high income. An example is PIMCO dynamic income closed fund (PDI).
5. Manufactured Yield Type 3: Distributions: Return of Capital and One-Off Capital Appreciation Some funds distribute returns that include a return of capital, which is essentially giving investors back their own money. This can make the yield appear higher than it truly is. One-off capital appreciations, such as special dividends or capital gains distributions, can also distort yield figures.
The Primacy of Total Return
Regardless of the extra cash or income you receive from your investments, you still need to monitor your investment’s price. It’s understandable that some investors don’t want to touch the principal or the underlying investments, but if your principal value keeps declining, your overall asset value declines as well. Therefore, it’s important to take a holistic view of your investments. This is where the concept of total return comes in, which includes both income (dividends or interest) and capital appreciation. On a logistical note, to withdraw a certain amount of income from your investment, you can always sell a portion of the investment to generate the cash.
MyPlanIQ has adopted the concept of total return throughout our funds and portfolio return and risk measurements. A precise definition of total return is that it includes the actual return of the underlying investment value with its dividends or distributions being reinvested immediately once distributed. This overall total return allows for an apples-to-apples comparison of fund or portfolio performance. Of course, you can still look at dividend yields to compare yields alone.
Now let’s take a concrete look at some of these (high) yield investments
Total returns of high yield stock funds
| ETF | Latest yield | YTD Return** |
1Yr AR | 3Yr AR | 5Yr AR | 10Yr AR | 15Yr AR |
|---|---|---|---|---|---|---|---|
| SDIV (Global X SuperDividend ETF) | 11.4% | 6.3% | 19.0% | -8.9% | -6.1% | -3.5% | |
| JEPI (JPMorgan Equity Premium Income ETF) | 7.6% | 6.8% | 13.2% | 7.8% | |||
| VIG (Vanguard Dividend Appreciation Index Fund ETF Shares) | 2.1% | 8.5% | 20.6% | 8.0% | 12.7% | 11.5% | 13.3% |
| VYM (Vanguard High Dividend Yield Index Fund ETF Shares) | 3.3% | 9.5% | 21.2% | 7.4% | 10.6% | 10.0% | 13.0% |
| XYLD (Global X S&P 500® Covered Call ETF) | 9.4% | 5.5% | 8.4% | 4.7% | |||
| PUTW (WisdomTree CBOE S&P 500 PutWrite Strategy Fund) | 10.2%(4.6%) | 9.0% | 16.5% | 8.5% | 8.3% | ||
| SPY (SPDR S&P 500 ETF Trust) | 1.6% | 11.7% | 29.4% | 10.0% | 15.0% | 12.9% | 14.8% |
For more dividend details, visit this comparison link and scroll down to the detailed table and scroll to the bottom in the table to find out calendar year and last 1, 3, 5, 10 year dividend yields.
In the above table,
- SDIV (Global X SuperDividend ETF) : The ETF boasts a whopping 11.4% annual yield without using leverage. It primarily seeks high-yield stocks globally. Currently, for example, its top holding is Yue Yuen Industrial Holdings, a stock listed on the Hong Kong exchange. Despite consistently delivering an average yield of around 7% (and at least 5% each year) since its inception in 2011, its total return has been underwhelming. In fact, over the past 10 years, it has had an annual total return of -3.5%! So, despite the attractive yield, an investor focused solely on this high-yield ETF has seen their investment cumulatively lose 30% over the past 10 years.
- JEPI (JPMorgan Equity Premium Income ETF): This ETF is perhaps one of the best among those that utilize derivatives such as options to generate income. There has been a flurry of such ‘high income’ ETFs in the market, aiming to entice income seekers. Other notable examples include the XYLD (Global X S&P 500® Covered Call ETF) and PUTW (WisdomTree CBOE S&P 500 PutWrite Strategy Fund). Both of these ETFs sell S&P 500 call options (with the underlying being S&P 500 index portfolios such as SPY) or sell S&P 500 put options.
- While these yields are high, or even extremely high, their total returns still tend to be lower than the S&P 500 total return (SPY), sometimes significantly so (XYLD 4.7% in the past 10 years vs. SPY’s 10%). For instance, despite generating substantial yields, these funds often lag behind in terms of overall performance due to the limited upside potential and increased risk associated with their options strategies.
- VIG (Vanguard Dividend Appreciation Index Fund ETF Shares) and VYM (Vanguard High Dividend Yield Index Fund ETF Shares): These two plain vanilla dividend ETFs, even though delivering much lower yields (2-3%), their total returns are still reasonably comparable to SPY’s.
- Other high income ETFs such as QYLD (Global X NASDAQ 100 Covered Call ETF) has substantially underperformed its QQQ equivalent — for the past 10 years, it had annualized total return 6.9%, compared with QQQ’ 18.9%, a 12% annual difference. See this link for more details.
What about for bonds? Let’s take a look at leveraged closed end bond funds vs regular bond funds:
| Ticker/Portfolio Name | Max Drawdown | YTD Return** |
1Yr AR | 3Yr AR | 5Yr AR | 10Yr AR | 10Yr Sharpe |
|---|---|---|---|---|---|---|---|
| PDI (PIMCO Dynamic Income Fund) | 46.5% | 13.1% | 22.5% | 0.8% | 2.3% | 7.5% | 0.34 |
| PONAX (PIMCO INCOME FUND CLASS A) | 13.4% | 1.2% | 7.4% | 0.9% | 2.5% | 3.7% | 0.65 |
The PDI fund employs 39% leverage, meaning it borrows an additional 39% of its capital to invest in corporate and other bonds. This leverage contributes to its high annual yield of 14.6%, compared to PONAX’s 6%.
Over the past 10 years, PDI has delivered significantly better total returns: 7.5% versus PONAX’s 3.7%. However, this higher return comes with increased risk. PDI experienced a maximum drawdown of 46.5%, compared to PONAX’s 13.4%. To put this in perspective, the SPY (S&P 500 index fund) had a maximum drawdown of 33.7% over the same period. Therefore, it can be safely claimed that PDI’s volatility is actually higher than that of a stock fund. This is evident from the following total return chart:
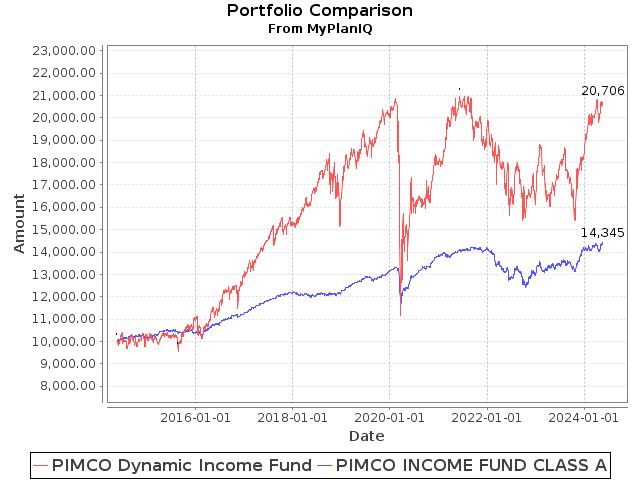
The huge ups and downs in the PDI total return chart are not for an income seeker with a faint heart!
Tactical High Dividend Strategy
On the other hand, we can utilize MyPlanIQ’s Composite Market Momentum strategy that’s employed in P Composite Momentum Market VFINX listed on Advanced Strategies page to a dividend fund such as VYM (Vanguard High Dividend Yield Index Fund ETF Shares) to reduce risk and improve total returns:
Income investors seeking yields should be also aware that they are subject to various tax treatments, which can significantly impact net returns. For instance:
- Qualified Dividends vs. Ordinary Dividends: Qualified dividends are taxed at the lower capital gains tax rate, whereas ordinary dividends are taxed at higher ordinary income rates.
- Interest Income: Interest from bonds and bond funds is typically taxed as ordinary income.
- Return of Capital: Distributions classified as return of capital are not immediately taxable but reduce the investor’s cost basis, leading to higher capital gains taxes upon sale.
- Option Income: Income from options can be complex, involving various tax treatments depending on the type and timing of the option. In general, if the income or yield is generated from an index option, such as call option premiums for the S&P 500 index, the income is typically treated as 60% long-term capital gain and 40% short-term capital gain. However, if the income comes from stock options, it is usually treated as short-term income, or ordinary income.
The takeaway
From the above discussions, we can conclude that it’s not a good idea to solely focus on yields. Instead, it’s important to take a total return approach that combines both price appreciation and dividends. Don’t be swayed by ‘high yield’ funds or fancy income mechanisms. A simple approach that invests in solid dividend funds like VIG (Vanguard Dividend Appreciation ETF) or VYM (Vanguard High Dividend Yield ETF), coupled with a tactical strategy to reduce interim loss or maximum drawdown, can provide a much better and steadier capital base that can be converted to income if necessary.
Market Overview
As the first quarter’s earnings report period draws to a close, Factset’s data as of May 17, 2024, reveals that S&P 500 companies, with 93% having reported actual results, recorded a 5.7% blended earnings growth for Q1 2024. This growth has alleviated some investor concerns regarding an earnings slowdown.
On the other hand, recent economic data points to a potential cooling period. In addition to a higher unemployment rate in April, both retail sales and industrial production have registered year-over-year declines. These indicators suggest that the economy might be slowing down, which could eventually push the Federal Reserve to consider reducing interest rates to ease financial conditions.
As a result, both stocks and bonds have risen in prices. However, we find ourselves in a delicate situation: if interest rates remain high for too long, it might be too late to prevent a potential recession, but acting too early could rekindle inflation. This balancing act highlights the ongoing challenges facing policymakers in maintaining economic stability.
As always, we claim no crystal ball and we call for staying the course which is guided by the well defined and sound strategic and tactical strategies:
- For strategic allocation (buy and hold) investors, ignore the current market behavior. Remember, as we have emphasized numerous times when you choose and commit to a strategic portfolio, you essentially know and commit that your investment horizon (or the time you need to utilize this capital) is 20 years, preferably much longer, given the current high valuation. As we pointed out, if your investments are those diversified (index) funds such as an S&P 500 index fund (VFINX, for example), you know your money is in some solid ‘business’ that eventually (20 years later and preferably many more years later) will deliver some reasonable returns. As long as you are comfortable with this thesis, you should sit tight and forget about the current gyration.
- For tactical investors, again, you have to ignore the current market noise. Furthermore, you should follow your strategy rigorously, especially during this time. Human emotion, both optimistic and pessimistic, and human desire, both greedy and fearful, are your worst enemies. This is true time and time again.
Stock valuation has dropped, and now valuation is becoming less hostile. However, it is still not cheap by historical standards. For the moment, we believe it’s prudent to be extra cautious. However, how serious a correction might be, we have confidence in the US economy in the long term and thus in the stocks in aggregate. We just need to manage through interim losses carefully.
We again would like to emphasize that for any new investor and new money, the best way to step into this kind of market is through dollar cost average (DCA), i.e., invest and/or follow a model portfolio in several phases (such as 2 or 3 months) instead of the whole sum at one shot.
Struggling to Select Investments for Your 401(k), IRA, or Brokerage Accounts?
Latest Articles
- Foreign Stock Investments — Currency Hedged Or Not?
- Unlocking Investment Potentials With 401(k) Brokerage Link Accounts
- Ranking Biggest 401(K) Stock And Bond Funds
- Rolling Returns: A Better Way To Evaluate & Compare Investments
- Index Funds As Businesses — Fundamental Indexing
- Investing In Industries With Better Business Models To Outperform Market Indexes
- S&P Good Sectors Review
- The State of The Economy, Market Trends, Valuation, And Internals
- Rules of Thumb For The New Year
- Best Active Bond ETFs
- Best Active Bond Mutual Funds
- Advanced Portfolios Review
- Growth At A Reasonable Price (GARP) Stock ETFs
- Market and Economy Review
- Maximizing Your Retirement Income: The 4% Withdrawal Rule & Retirement Withdrawal Calculator
- How To Fully Utilize Self-Directed IRAs For Retirement Investments
- Newsletter Collection Update
- Portfolio Calculator (Simulator) And Rolling Returns
- ETFs In Asset Classes For Portfolio Construction
- Retirement Savings: How Much Should You Save For A Comfortable Retirement Life?
- High Yield Bonds Are Good Alternatives For Aggressive Fixed Income Investors
- Trends, Factors & Indicators
- Lazy Portfolios Review
- ‘Best’ Tactical Stock or Dividend Income Balanced Portfolios vs. Best Balanced Allocation Fund
- ‘Best’ Stock or Dividend Income Balanced Portfolios vs. Best Balanced Allocation Fund
- Low-Cost Stock Index Funds: Quality ‘Business Conglomerates’ for Solid, Low-Risk Long-Term Returns
- Cash And Money Market ETFs Review
- March 27, 2023: 401k Company Match: How To Maximize Your Free Money
- March 13, 2023: Bank On My Own For Safer And Much Higher Returns
- February 27, 2023: Dimensional Fund Advisors and Capital Group ETFs
- February 13, 2023: In Praise Of A Conservative Strategic Asset Allocation
- January 30, 2023: The Bond Era
- January 16, 2023: International Stocks In Asset Allocation
- January 3, 2023: Review And Outlook
- December 5, 2022: Latest Market And Trend Review
- November 21, 2022: How To Maximize Your Cash Return
- November 7, 2022: Tactical Bond Fund Portfolios Consistently Outperform
- October 24, 2022: S&P 500: A Solid ‘Business’ In A Volatile Time
- October 10, 2022: 9.62% Treasury I Bonds: Cash Is Indeed King
- September 26, 2022: Markets, Noises, Long Term Strategies …
- September 12, 2022: Factor ETFs Review
- August 29, 2022: Cash Is King
- August 15, 2022: Asset Trends Review
- August 1, 2022: What We Can Learn From 1970s And 1980s
- July 18, 2022: Fixed Income Is Becoming An Alternative
- July 1, 2022: About The Latest Rebalance
- June 6, 2022: Sector Rotation In A Rising Rate Environment
- May 23, 2022: Latest Portfolio And Trend Review
- May 9, 2022: The Secular Market Cycle Change
- April 25, 2022: Survivorship Bias, Sentiment And Market Internals …
- April 11, 2022: Asset Allocation And Risk Management
- March 28, 2022: March Madness And Steady Course
- March 14, 2022: Quality Sectors Prevail
- February 28, 2022: Asset Allocation Fund Review
- February 14, 2022: Inflation, Interest Rates And Fixed Income Investments
- February 1, 2022: Foreign Stocks And Global Asset Allocation
- January 18, 2022: Steady And Consistency Win In The Long Term
- January 3, 2022: The Year In Rear View: Portfolio And Asset Class Review
- December 13, 2021: Present And Future
- November 22, 2021: The ‘Best’ Balanced Fund Revisited
- November 15, 2021: Q&A On MyPlanIQ Strategies And Portfolios
- November 8, 2021: Major Asset Returns In The Past Twenty Years
- November 1, 2021: Latest Momentum Factor ETFs Review
- October 25, 2021: A Long Term Theme Or Trend Doesn’t Necessarily Yield Good Returns
- October 18, 2021: Dimensional Fund Advisors DFA ETFs
- October 11, 2021: MyPlanIQ Ultra Short Term Bond Portfolio vs. Other Funds
- October 4, 2021: Asset Trends, Market Internals And Inflation Implication
- September 27, 2021: Newsletter Collection Update
- September 20, 2021: Benchmarking MyPlanIQ Fixed Income Bond Portfolios
- September 13, 2021: Benchmarking MyPlanIQ Tactical Portfolios
- August 30, 2021: Invest And Speculate: A Sensible Alternative To Buy And Hold
- August 23, 2021: Style ETF Portfolio Review
- August 16, 2021: Smart Factor ETFs Review
- August 9, 2021: Best Global Allocation Funds vs. MyPlanIQ ETF Portfolios
- August 2, 2021: Major Asset Trends And Market Internals
- July 26, 2021: Ultra Short Term Bond ‘Money Market’ Portfolio And Banking
- July 19, 2021: Take The Challenge of The ‘Best’ Balance Fund
- July 12, 2021: The Long Forgotten Bear Market Cycles
- June 28, 2021: Resuming Growth Trends Chaotically?
- June 21, 2021: Stocks Are Not Replacement Of Bonds
- June 14, 2021: Outperform The Best Performing PIMCO Income Bond Fund
- June 7, 2021: “Good” S&P Sectors
- May 17, 2021: Total Return Bond ETFs Review
- May 10, 2021: Financial Independence & Early Retirement
- May 3, 2021: Inflation, Sub Zero Interest Rate …
- April 26, 2021: The Best Active Fixed Income Funds Are Still Hard To Beat
- April 19, 2021: New And Old Useful Features
- April 12, 2021: Risk Parity Funds In Current Environment
- April 5, 2021: DoubleLine Shiller CAPE 10 Based Funds Update
- March 29, 2021: International Stocks vs. US Stocks
- March 22, 2021: Ultra Short Term Bond ETF Portfolio As A Money Market Fund
- March 15, 2021: Make Your Own Private Bank
- March 8, 2021: The Not So Orderly Market Rotation Amid Rising Bond Yields
- March 1, 2021: Average 20% Annual Returns: The Upper Bound Of Stock Investments?!
- February 22, 2021: Rising Bond Yields And Current Stock Trends
- February 8, 2021: Total Return Bond ETFs Review
- February 1, 2021: REITs And Major Asset Trends
- January 25, 2021: Industry ETFs And ARK ETFs Portfolios
- January 11, 2021: Smart Cash Management: Can I Just Withdraw From My Bond Portfolio?
- January 4, 2021: Our Investment Philosophy For 2021 And Beyond
- December 14, 2020: Style and Factor ETFs Portfolio Reviews
- December 7, 2020: A Really Long Term (30 Years) Stock Returns
- November 30, 2020: Higher Return Portfolios: Part 2
- November 16, 2020: Higher Return Portfolios
- November 9, 2020: Fixed Income Funds Update
- November 2, 2020: Polls Are Useless vs. This Investment Strategy Doesn’t Work!
- October 26, 2020: Recent Improvements
- October 19, 2020: REIT Indexes As Businesses
- October 12, 2020: Stock Indexes As Businesses
- October 5, 2020: Asset Trend Review
- September 28, 2020: Retirement Spending: Your Portfolio’s Volatility Matters
- September 21, 2020: Boring Utility Stocks Are Excellent Long Term Winners
- September 14, 2020: Surprised, Active Fixed Income Investors Have Done Better Than Stock Investors For The Last 20 Years!
- August 31, 2020: Investing In An Ultra-Low Return Environment
- August 24, 2020: Target Maturity Bond ETFs For Short Term Cash
- August 17, 2020: Newsletter Collection Update
- August 10, 2020: Fixed Income In A Speculative Era
- August 3, 2020: Sound Investment Strategies
- July 27, 2020: Total Return Bond Funds Update
- July 20, 2020: Divergence Between Value And Growth Stocks Everywhere
- July 13, 2020: Short Term Cash, Treasury Bills, CDs And Future Fixed Income
- July 6, 2020: Bond ETFs vs. Bond Mutual Funds
- June 29, 2020: Industry Sector ETF Rotation With Composite Momentum
- June 22, 2020: Industry Sector Rotation With Composite Momentum
- June 15, 2020: Advanced Minimum Equity Portfolios
- June 8, 2020: Recent Positive Developments
- June 1, 2020: Minimum Equity Portfolios
- May 18, 2020: Core Satellite Portfolios In The Current Pandemic
- May 11, 2020: Asset Trends Review
- May 4, 2020: The Real, Sensible And Wise Warren Buffett
- April 27, 2020: Total Return Bond Funds & Portfolios
- April 20, 2020: Multi-Factor ETFs and Rotation
- April 13, 2020: A Closer Look At 401(k) Investment Portfolios
- April 6, 2020: Long Term Stock Market Timing Since 1871 Revisited
- March 30, 2020: How Did Bond ETFs And Mutual Funds Fare In The Current Crisis?
- March 23, 2020: Chaos And Hope
- March 16, 2020: A Live Lesson
- March 9, 2020: Risk And Reward
- March 2, 2020: The Risk Of Coronavirus Outbreak
- February 24, 2020: Long Term Stock Valuation Based Investment Strategies
- February 10, 2020: Update On Short Term Cash, Treasury Bills and Brokered CDs
- February 3, 2020: Investment Landscape For Retirees And Would-be Retirees: Stocks
- January 27, 2020: Investment Landscape For Retirees And Would-be Retirees: Fixed Income
- January 13, 2020: Portfolio Performance: A Walk In The Past II
- January 6, 2020: Asset Outlook and Portfolio Strategies
- December 16, 2019: Q&As On Our Services
- December 9, 2019: Portfolio Constructions For Advanced Users
- December 2, 2019: Newsletter Collection Update
- November 25, 2019: Core ETFs or Core Mutual Funds Portfolios
- November 18, 2019: Introducing MyPlanIQ Asset Allocation Composite Strategy
- November 11, 2019: Market Indicator And Momentum
- November 4, 2019: Factor ETF Rotation
- October 28, 2019: Multi-factor ETFs vs. Equal Weight Multi-Factor Portfolios
- October 21, 2019: Multi-factor ETFs: Value And Momentum
- October 14, 2019: Low Volatility Factor ETFs
- October 7, 2019: Zero Commission Era Has Arrived, Is It Really That Good?
- September 30, 2019: Boosting Bond ETF Portfolio’s Return With Muni Bond ETFs
- September 23, 2019: Value ETFs
- September 16, 2019: Factor ETFs
- September 9, 2019: Momentum Factor Stock ETFs
- August 26, 2019: Employer 401k Match: Yet Another Free Lunch Not To Be Missed
- August 19, 2019: PIMCO Income Fund and Other Total Return Bond Funds Update
- August 12, 2019: Aggressive Fixed Income Portfolios?
- August 5, 2019: Long Term Investment Strategies And Short Term Market Noises
- July 29, 2019: Fixed Income Portfolios In A Lower Yield Environment
- July 22, 2019: Core Satellite Portfolios Balance Fluctuation
- July 15, 2019: Quality Stock Factor ETFs
- July 8, 2019: Surprise! Brokerages Make Most From Your Cash, Not Commissions
- July 1, 2019: Utilities Sector Review
- June 24, 2019: Asset Allocation Funds Review
- June 17, 2019: Latest Performance Comparison Among Several Advanced Strategies
- June 10, 2019: Money Market And Ultra Short Term Bond Funds
- June 3, 2019: What We Can Learn From The Seasonality Strategy
- May 20, 2019: Morningstar Portfolio Manager Awards
- May 13, 2019: Total Return Bond ETFs Review
- May 6, 2019: Global Allocation Revisited
- April 29, 2019: Asset Trend Review
- April 22, 2019: The Current State Of Fixed Income
- April 15, 2019: The Importance Of Fixed Income Returns For Retirement Spending
- April 8, 2019: Newsletter Collection Update
- April 1, 2019: S&P 500 As A Business
- March 25, 2019: Health Care Sector Review
- March 18, 2019: The Risk Of Stock Investing
- March 11, 2019: Consumer Staples Sector Review
- March 4, 2019: Global Stock Valuation Update
- February 25, 2019: ‘Bad’ Tactical Strategy
- February 11, 2019: “Best” Balanced Fund And Portfolios Revisited
- February 4, 2019: Cash And Money Market Funds: Interests And Safety
- January 28, 2019: Fixed Income Review
- January 14, 2019: Tactical Asset Allocation Portfolio Review
- January 7, 2019: Global Strategic Asset Allocation Portfolio Review
- December 17, 2018: Robinhood’s ‘Revolution’ Or Gimmick
- December 10, 2018: How Defensive Are REITs?
- December 3, 2018: Conservative Core Satellite Portfolio
- November 26, 2018: Allocation Mutual Fund Review
- November 19, 2018: Is The Recent Downtrend Sustainable?
- November 12, 2018: The Staggering Low Interest Rates From Big Banks
- November 5, 2018: The ‘Right’ Or ‘Wrong’ Decision
- October 29, 2018: Taxable Total Return Bond Plus Muni Bond Fund Based Portfolios
- October 22, 2018: DoubleLine Shiller CAPE 10 Based Fund Review
- October 15, 2018: Newsletter Collection Update
- October 8, 2018: Asset Trend Review
- October 1, 2018: Taxable vs. Tax Exempt High Yield Bonds
- September 24, 2018: High Yield Bonds In A Rising Rate Environment
- September 10, 2018: Value, Growth And Blend Stock Style Investing
- August 27, 2018: Money Market ETFs?
- August 20, 2018: How Momentum Investing Stacks Up?
- August 13, 2018: Total Return Bond ETF
- August 6, 2018: Fidelity Zero-Fee Index Funds
- July 30, 2018: Tax Efficient Portfolios
- July 23, 2018: Municipal Bond Funds And Portfolios
- July 16, 2018: A Guide To Conservative Portfolios
- July 9, 2018: Conservative Allocation Mutual Funds Based Portfolios
- July 2, 2018: Small Cap Stocks For The Long Term
- June 25, 2018: What Can We Learn From GE’s Removal From Dow Jones Index?
- June 18, 2018: The ‘Best’ Balanced Portfolio Continues To Excel
- June 11, 2018: Is 10 Year Long Enough For Portfolio Comparison?
- June 4, 2018: Action Plan: Risk Review For Investments
- May 21, 2018: Rising Rates, Consumer Staples And Stock Index
- May 14, 2018: Newsletter Collection Update
- May 7, 2018: Money Market Fund Taxonomy
- April 30, 2018: Momentum Investing Review
- April 23, 2018: Commodities In Current Environment
- April 16, 2018: Municipal Bonds As A Fixed Income Asset Class
- April 9, 2018: Exponential Or Compounding Nature In Investing
- April 2, 2018: Inside Of The Stock Chaos
- March 26, 2018: Total Return Bond Update
- March 19, 2018: Treasury Bills vs. Brokered CDs
- March 12, 2018: Defensive Conservative Portfolio Review
- March 5, 2018: Warren Buffett’s Advices
- February 26, 2018: Pros And Cons of Strategic And Tactical Portfolios In 2018
- February 12, 2018: Trend Review
- February 5, 2018: Market Selloff And Long Term Investing
- January 29, 2018: The New Addition To Our Total Return Bond Fund Candidates
- January 22, 2018: Where Are Bonds Heading?
- January 15, 2018: Tactical Portfolios Review
- January 8, 2018: Strategic Portfolios Review
- December 18, 2017: Record Highs And Risk
- December 11, 2017: Cash Return And Interest Rate Update
- December 4, 2017: Mutual Fund Star Ratings: Are They Useful?
- November 20, 2017: Thankful And Mindful
- November 13, 2017: Is This A Good Time For Retirees Or Would Be Retirees?
- November 6, 2017: Newsletter Collection Update
- October 30, 2017: Rising Interest Rates
- October 23, 2017: A Primer For Portfolios
- October 16, 2017: REITs As An Asset Class
- October 9, 2017: Conservative Portfolios Revisited
- October 2, 2017: The Role of Short Term Bond Funds
- September 25, 2017: Fees In Cash Investments
- September 18, 2017: Conservative Portfolios Review
- September 11, 2017: International Diversification Effect
- September 4, 2017: Invest And Speculate Revisited
- August 28, 2017: Total Return Bond Fund Portfolios: Where Do They Fit?
- August 21, 2017: Portfolio Performance: A Walk In The Past
- August 14, 2017: Fidelity Commission Free ETFs Update
- August 7, 2017: I Didn’t Learn Anything — Mistake vs. Temporary Underperformance
- July 31, 2017: Asset Classes And Fund Choices: A Primer
- July 24, 2017: Total Return Bond Fund Portfolios And Cash
- July 17, 2017: Long Term Stock Holding Periods For Retirement
- July 10, 2017: Half Year Asset Trend Review
- June 26, 2017: How To Beat The Best Balanced Allocation Fund
- June 19, 2017: Newsletter Collection Update
- June 12, 2017: A Mixed Bag Performance of Momentum Investing
- June 5, 2017: How To Start A New Portfolio
- May 29, 2017: Alternative Assets And Their Role In Portfolios
- May 22, 2017: Summer Seasonality And Portfolio Management
- May 15, 2017: Cash: Banking Or Investing?
- May 8, 2017: Holding Period of Long Term Timing Portfolios
- May 1, 2017: Debate on Risk vs. Volatility
- April 24, 2017: The Long Term Stock Market Timing Return Since 1871
- April 17, 2017: Risk vs. Volatility: Long Term Stock Market Returns
- April 10, 2017: Total Return Bond ETFs And Portfolios
- April 3, 2017: Quarter End Asset Trend Review
- March 27, 2017: Practical Consideration For IRAs And 401k Accounts
- March 20, 2017: Fund Fees: That’s (Still) Outrageous
- March 13, 2017: Long Term Stock Valuation Review
- March 6, 2017: Asset Classes for Retirement Investments
- February 27, 2017: Fidelity Total Bond Fund Review
- February 20, 2017: Long Term Stock Timing Based Portfolios And Their Roles
- February 13, 2017: Alternative Investment Portfolios Review
- February 6, 2017: Tax Free Municipal Bond Investments Review
- January 30, 2017: Brokerage Specific Conservative Portfolios
- January 23, 2017: Fixed Income Portfolio Review
- January 16, 2017: Long Term Trend Following Portfolio Review
- January 9, 2017: Tactical Asset Allocation Review
- January 3, 2017: Strategic Asset Allocation Review
- December 12, 2016: Enhanced Index Funds
- December 5, 2016: Review Of Broad Base Core Mutual Funds For Brokerages
- November 28, 2016: Core Index ETFs Review
- November 21, 2016: International Exposure Of U.S. Large Companies
- November 14, 2016: Asset Trends After The Election
- November 7, 2016: Rising Rate And Current Bond Trend
- October 31, 2016: Economy Power And Long Term Stock Returns
- October 24, 2016: Current Commodity Trend And Managed Futures
- October 17, 2016: Investment Mistakes And Good Or Bad Investment Strategies
- October 10, 2016: Momentum Investing Review
- October 3, 2016: Survey & Feedback
- September 26, 2016: Fixed Income Investing: Actively Managed Funds vs. Index Funds
- September 19, 2016: Stock Investing: Actively Managed Funds vs. Index Funds
- September 12, 2016: Newsletter Update
- September 5, 2016: Overvalued Markets And Long Term Timing Strategies
- August 29, 2016: Your 401K Finally Draws Attention
- August 22, 2016: Inflation Protected Securities TIPS For Current Overvalued Markets
- August 15, 2016: Risk On: Emerging Market Stocks And Small Cap Stocks
- August 8, 2016: Portfolio Construction Using Stock ETFs And Bond Mutual Funds
- August 1, 2016: Adding Value To Your Own Investments
- July 25, 2016: Tactical Asset Allocation Funds Review
- July 18, 2016: Strategic Asset Allocation & Lazy Portfolio Review
- July 11, 2016: Asset Trend Review
- June 27, 2016: Secular Cycles For Tactical And Strategic Investment Strategies
- June 20, 2016: A World of Debt
- June 13, 2016: Managed Futures For Portfolio Building
- June 6, 2016: Newsletter Summary
- May 30, 2016: Swensen Portfolio And Permanent Portfolios
- May 23, 2016: AAII Article And Some Web Changes
- May 16, 2016: The PIMCO (Dis)Advantages
- May 9, 2016: Boost Your Dull Summer Investments
- May 2, 2016: Low Cost Index Fund Investing
- April 25, 2016: Tax Free Municipal Bond Funds & Portfolios
- April 18, 2016: Asset Class Trend Review
- April 11, 2016: Construction of Sound And Conservative Portfolios
- March 28, 2016: Total Return Bond ETFs Review
- March 21, 2016: Small And Large Company Stock Performance In Different Economic Expansion Cycles
- March 14, 2016: Are Tactical And Timing Strategies Losing Steam?
- March 7, 2016: Defined Maturity Bond Fund Analysis
- February 29, 2016: Smart Strategic Asset Allocation Rebalance When Market Trend Changes
- February 22, 2016: Be Cash Smart
- February 15, 2016: Bond ETF Portfolios
- February 8, 2016: Newsletter Collection Update
- February 1, 2016: Total Return Bond Fund Portfolios In A Volatile Period
- January 25, 2016: Alternative Portfolios Review
- January 18, 2016: Strategic Asset Allocation: A Cautious Outlook
- January 11, 2016: Review Of Trend Following Tactical Asset Allocation
- January 4, 2016: What Worked And Didn’t In 2015
- December 21, 2015: Distressed Assets
- December 14, 2015: High Yield Bonds And Their Correlation With Stocks
- December 7, 2015: Diversification And Global Allocation
- November 30, 2015: Investors and Speculators Combined
- November 23, 2015: Active Stock Fund Performance Consistency
- November 16, 2015: Permanent, Risk Parity And Alternative Portfolios Review
- November 9, 2015: Broad Base Core Mutual Fund Review
- November 2, 2015: Broad Base Index Core ETFs Review
- October 26, 2015: Total Return Bond Fund Review
- October 19, 2015: Advanced Portfolio Review
- October 12, 2015: What About Commodities?
- October 5, 2015: Core Satellite Portfolios In A 401k Account
- September 28, 2015: Risk Managed Strategic Asset Allocation Portfolios Revisited
- September 21, 2015: Quest For The Best Investment Strategy
- September 14, 2015: Core Satellite Portfolios In Market Turmoil
- September 7, 2015: Market Rout Creates An Opportunity to Reposition Your Portfolios
- August 31, 2015: Review of Asset Allocation Funds and Portfolios
- August 24, 2015: Market Rout And Your Portfolios
- August 17, 2015: ETF or Mutual Fund Based Portfolios
- August 10, 2015: Updated Newsletter Collection
- August 3, 2015: Slippery Asset Trends
- July 27, 2015: Performance Dispersion Among Momentum Based Portfolios
- July 20, 2015: Global Balanced Portfolio Benchmarks
- July 13, 2015: Pain in Tactical Portfolios
- July 6, 2015: Fixed Income Total Return Bond Funds In Strategic Asset Allocation Portfolios
- June 29, 2015: Core ETF Commission Free Portfolios
- June 22, 2015: Secular Asset Trends
- June 15, 2015: Giving Up Bonds?
- June 1, 2015: Summer Blues?
- May 26, 2015: Cash, Bonds and Stocks In A Rising Rate Environment
- May 18, 2015: Portfolio Update
- May 11, 2015: Pain in Fixed Income?
- May 4, 2015: The Balanced Stock and Long Term Treasury Bond Portfolios
- April 27, 2015: Long Term Treasury Bond Behavior
- April 20, 2015: 529 College Savings Plan Rebalance Policy Change
- April 13, 2015: Total Return Bond Funds As Smart Cash
- April 6, 2015: The Low Return Environment
- March 30, 2015: Brokerage Specific Core Mutual Fund Portfolios 2
- March 23, 2015: Investment Arithmetic for Long Term Investments
- March 16, 2015: Brokerage Specific Core Mutual Fund Portfolios
- March 9, 2015: Newsletter Collection Update
- March 2, 2015: Total Return Bond ETFs
- February 23, 2015: Why Is Global Tactical Asset Allocation Not Popular?
- February 16, 2015: Where Are Permanent Portfolios Going?
- February 9, 2015: How Have Asset Allocation Funds Done?
- February 2, 2015: Risk Management Everywhere
- January 26, 2015: Composite Portfolios Review
- January 19, 2015: Fixed Income Investing Review
- January 12, 2015: How Does Trend Following Tactical Asset Allocation Strategy Deliver Returns
- January 5, 2015: When Forecast Fails
- December 22, 2014: Long Term Asset Returns: How Long Is Long?
- December 15, 2014: Beaten Down Assets
- December 8, 2014: Implementing Core Asset Portfolios In a Brokerage
- December 1, 2014: Two Key Issues of Investment Strategies
- November 24, 2014: Holiday Readings
- November 17, 2014: Retirement Spending Portfolios Update
- November 10, 2014: Fixed Income Or Cash
- November 3, 2014: Asset Trend Review
- October 27, 2014: Investment Loss, Mistakes And Market Cycles
- October 20, 2014: Strategic Portfolios With Managed Volatility
- October 13, 2014: Embrace Volatility
- October 6, 2014: Tips For 401k Open Enrollment
- September 29, 2014: What Can We Learn From Bill Gross’ Departure From PIMCO?
- September 22, 2014: Why Total Return Bond Funds?
- September 15, 2014: Equity And Total Return Bond Fund Composite Portfolios
- September 8, 2014: Momentum Based Portfolios Review
- September 1, 2014: Risk & Diversification: Mint.com Interview
- August 25, 2014: Remember Risk
- August 18, 2014: Consistency, The Most Important Edge In Investing: Tactical Case
- August 11, 2014: What To Do In Overvalued Stock Markets
- August 4, 2014: Is This The Peak Or Correction?
- July 28, 2014: Stock Musings
- July 21, 2014: Permanent Portfolios & Four Pillar Foundation Based Framework
- July 14, 2014: Composite Portfolios Review
- July 7, 2014: Portfolio Behavior During Market Corrections
- June 30, 2014: Half Year Brokerage ETF and Mutual Fund Portfolios Review
- June 23, 2014: Newsletter Collection Update
- June 16, 2014: There Are Always Lottery Winners
- June 9, 2014: The Arithmetic of Investment Mistakes
- June 2, 2014: Tips On Portfolio Rebalance
- May 26, 2014: In Praise Of Low Cost Core Asset Class Based Portfolios
- May 19, 2014: Consistency, The Most Important Edge In Investing: Strategic Case
- May 12, 2014: How To Handle An Elevated Overvalued Market
- May 5, 2014: Asset Allocation Funds Review
- April 28, 2014: Now The Economy Backs To The ‘Old Normal’, Should Our Investments Too?
- April 21, 2014: Total Return Bond Investing In The Current Market Environment