
How to Become a 401(k) Millionaire?
In this issue:
- Retirement savings: Social security cola (Cost of Living Adjustment)
- Savings & investing consistently for the long-term
- Dollar-cost averaging historical calculator
- Mastercard savings plan: one of the highest employer match?
- Market overview: stocks continued to rise while long-term bond yields persistently high
Social Security Cost-of-Living Adjustment (COLA)
The Social Security Administration has announced a 2.5% cost-of-living adjustment (COLA) for 2025. Currently, 72.5 million people are receiving Social Security benefits and Supplemental Security Income (SSI) payments.
Some data:
- The average monthly Social Security benefit for all Social Security recipients: $1,783.55
- So on average, the COLA monthly increase is $50
Social Security benefits make up one part of your retirement income, but most people can’t rely on them alone. However, they’re a central piece of retirement planning, providing a dependable source that’s always there to support you.
Other retirement income:
- Tax-deferred or tax-exempt retirement savings: 401(k), 403(b), IRA, Roth IRA, and more
- Company pension
- Taxable savings & investments
- Others like houses, real estate investments and properties
It’s worth noting that company pensions have become far less common, now mainly found in government jobs and a few large companies. Defined contribution savings plans like 401(k)s are now the standard. Unfortunately, many people see these types of savings as optional and only realize the importance of consistent contributions as they approach retirement age.
Becoming a 401(k) Millionaire: Consistent Long-Term Saving & Investing
Now that we have your attention, let’s dig into why consistent, long-term saving and investing is crucial. First, take a look at our Dollar Cost Average Calculator for Portfolio, Fund, or Stock. If you review the table here, you’ll notice the IRS annual 401(k) contribution limit was $13,000 in 2004 (20 years ago), with a midpoint of $17,500 in 2014. Assuming you’ve maxed out your annual 401(k) contributions at this midpoint and invested fully in an S&P 500 index fund (like VFINX), your account balance would now be around $1.2 million.

You might argue that putting 100% of your investment in an S&P 500 index fund, which is all stocks, is too aggressive. Instead, let’s consider a more balanced approach with MyPlanIQ Core Three Assets portfolio (using the ‘Three Asset Portfolio Historical Returns’ option). This portfolio has a moderate allocation, with 40% invested in bonds (see Asset Allocation Portfolio Templates for more details).
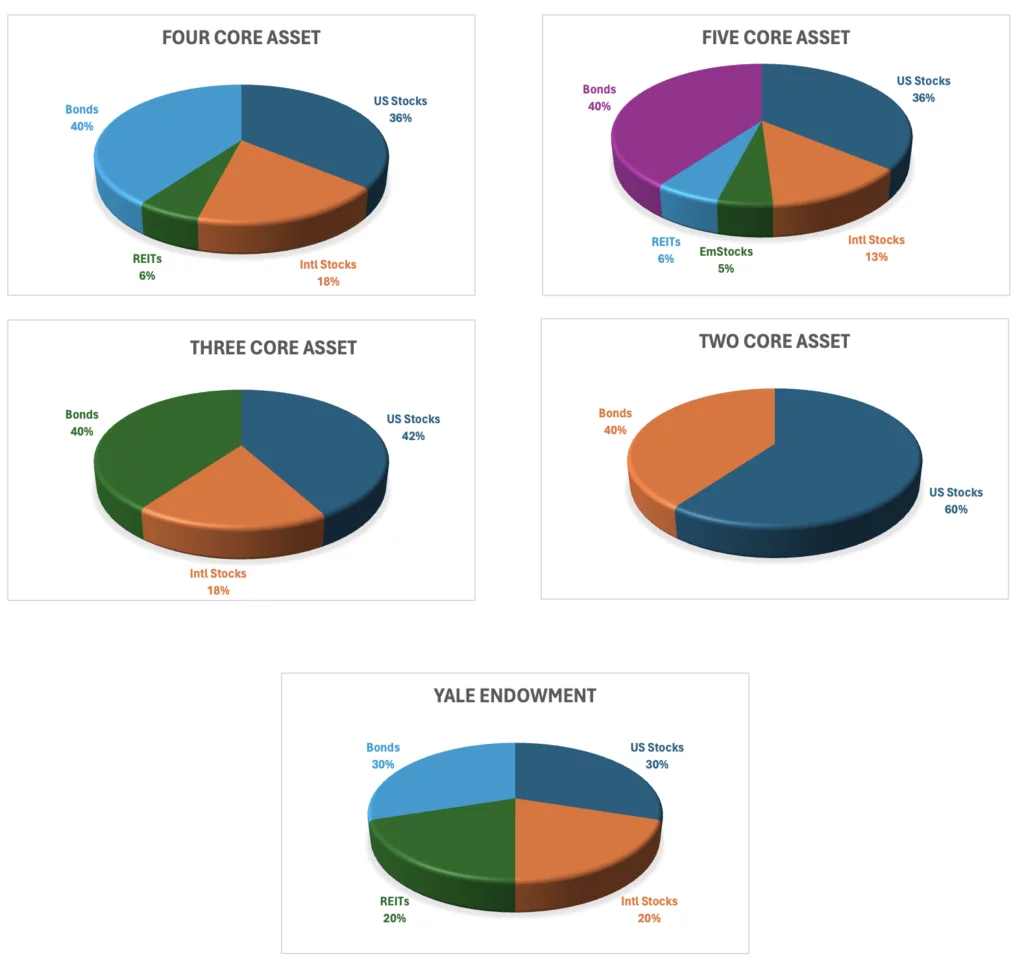
If you had started investing in this balanced portfolio back in 1999, you’d have accumulated around $1.1 million by now!
20 years or 25 years are very reasonable time to save in your retirement 401(k). So start early and invest consistently in solid low cost index funds, you’ll do well in your retirement savings. Saving for 20 to 25 years in your retirement 401(k) is a realistic timeframe to build significant wealth. Starting early and consistently investing in solid, low-cost index funds can lead to substantial growth in your retirement savings. The power of compound interest over time allows your investments to grow significantly.
We often hear people say, “I can just wait until I’m older to start saving for retirement.” Well, don’t! It can make a huge difference, as shown above.
Tools & Tips
The Dollar Cost Average Calculator for Portfolio, Fund, or Stock is a very useful tool for back-testing historical DCA results. This calculator allows you to input an investment symbol, such as a stock—want to see the DCA results for Apple (AAPL)? The outcome will astonish you: investing $10,000 annually in AAPL since 2004 could yield you $12 million! You can also use it for funds like the S&P 500 ETF (SPY) or Nasdaq 100 (QQQ), and even for a MyPlanIQ portfolio. You can find the symbol for your MyPlanIQ portfolio on that portfolio’s page.For example, you will see symbol P_77002 on MyPlanIQ Core Three Assets page, just below its portfolio title.
You should select the ‘Fund or Portfolio Symbol’ option from the ‘Investment Symbol’ dropdown menu. The calculator will then use the historical returns of that investment over the specified number of years (for instance, if you choose 20 in the ‘Investment Length (Years)’ parameter, it will use the last 20 years of data) and simulate results up to the present, providing outcomes such as End Balance, Total Gains, and Total Investment.
Experiment with your own existing portfolio or funds to gain a better understanding of past performance. Keep in mind that we are currently at the peak of a long-running bull market. However, long-term investing remains a powerful strategy, regardless of when or where you start. See, for example, 150+ Years of Long-Term Earnings and Stock Returns of the ‘Conglomerate’ of Collective S&P 500 Index Companies.
Mastercard Savings Plan — Generous Employer Match!
MyPlanIQ maintains comprehensive information on employer matching contributions across various 401(k) plans. Below are the employee contribution and employer matching policies for the MASTERCARD SAVINGS PLAN:
- Employee Contribution Rates: Employees can contribute up to 10% of their salary, starting at a default rate of 6% unless they opt for a different contribution rate.
- Employer Match/Contribution Conditions: The employer matches 167% on the first 6% of base wages contributed by the employee.
- Vesting Schedule/Eligibility: Participants are fully vested immediately in their employee and employer matching contributions, with no specified years of service or hours worked required for eligibility.
- Roth 401(k) contributions are allowed.
So Mastercard matches 10.02% on your first 6% savings. This is truly a 10% ‘free salary raise’. From our database, we see that 6% match is perhaps already very generous.
Market Overview
The following table shows the major asset price returns:
| Asset Class | 1 Weeks | 4 Weeks | 13 Weeks | 26 Weeks | 52 Weeks | Trend Score |
|---|---|---|---|---|---|---|
| US Stocks | -1.0% | 1.3% | 6.7% | 14.6% | 42.9% | 12.9% |
| Foreign Stocks | -0.8% | -3.2% | 3.5% | 6.5% | 25.3% | 6.2% |
| US REITs | 0.5% | -1.4% | 7.6% | 21.0% | 39.5% | 13.4% |
| Emerging Mkt Stocks | -1.0% | -1.5% | 8.1% | 10.9% | 26.8% | 8.7% |
| Bonds | -0.4% | -2.6% | 1.0% | 4.8% | 10.3% | 2.6% |
We are now entering the earnings report period for Q3 (Quarter 3). According to Factset, as of last Friday, 37% of S&P 500 companies have reported their Q3 2024 earnings, and the current blended year-over-year earnings growth rate is 3.6%. This figure is lower than the expected 4.3% as of September 30. As more companies release their earnings, we will gain a clearer understanding of overall performance for the quarter.
Struggling to Select Investments for Your 401(k), IRA, or Brokerage Accounts?