
Special Issue: Staying the Course Amid Market Turmoil
This special issue is for both our paid and free subscribers at this crucial volatile market times.
In this issue:
- Latest in Retirement Savings & Personal Finance: Market Turmoil, Majority of Americans Invest in Stocks, …
- Staying the Course Amid Market Turmoil
- Tools & Tips: Longest S&P 500 Losses (Drawdowns)
- Market Overview
Latest in Retirement Savings & Personal Finance: Market Turmoil, Majority of Americans Invest in Stocks, Gold Shines
Market Turmoil
On April 3, the Trump administration’s sweeping tariffs on imports from 185 countries caused significant market sell-offs. Over the two trading days immediately following the announcement, the S&P 500 alone saw a decline of 10.5%, wiping out nearly $5 trillion in market capitalization, marking the largest two-day loss since March 2020!
How Many Americans Are Hurt?
Though the administration claimed that only 20% of “rich” Americans hold stocks and, thus, the stock market rout wasn’t felt by the majority of Americans, the reality is that, based on a Gallup survey, 62% of U.S. adults have money invested in the stock market, mostly through their retirement accounts, such as 401(k)s . The Fed data shows that a record 43.5% of the financial assets of U.S. households (including nonprofit organizations) are in equities. It is an understatement to say that the recent stock market decline doesn’t hurt most Americans and doesn’t erode their confidence .
Global Implication of Tariffs
The tariffs have not only hurt U.S. markets but also strained global economies. For instance, France expects a GDP reduction of 0.5 percentage points due to the tariffs. Critics argue that these policies could lead to higher consumer prices and prolonged economic instability. A global recession could likely be caused by the recent tariff policy change.
Gold Shines Until It Doesn’t
Even before the recent tariff policy, the price of gold had risen steadily, an indication that investors are wary of inflation. As always, gold is usually perceived to be some sort of safe haven before an economic crisis, but at the height of distress, its price, too, is usually dragged down along with other assets in a panic sale.
Staying the Course Amid Market Turmoil
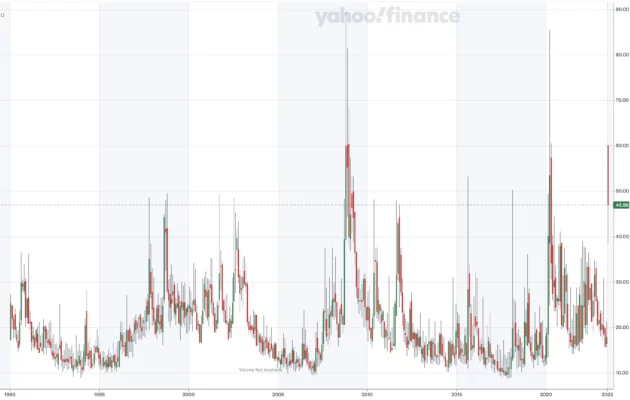
It’s scary that stock markets dropped violently in the past 3 days. In fact, the cboe volatility index VIX, which measures how much risk or uncertainty traders view on the S&P 500 index near term, rose as high as 60, almost matching the high in the Covid scare in 2020. The VIX value even surpassed those in the 2000 internet bubble burst times:
Market turmoil is not a new phenomenon; it has been an integral part of the financial landscape for over 150 years, ever since 1871. Throughout history, major bear markets have tested investors’ resolve, often triggered by economic recessions, geopolitical crises, or speculative bubbles. For example, the Great Depression of the 1930s, the oil shocks of the 1970s, the dot-com bust in 2000, and the 2008 financial crisis all sent markets spiraling into bear territory. While these downturns were painful at the time, they also demonstrated the resilience of markets over the long term. Below is a visual representation of some of the most significant bear markets, along with the S&P 500 index price chart:

For many younger investors, the recent market volatility may feel unprecedented, as they have yet to experience even one full market cycle, such as the 2008 financial crisis. However, for Baby Boomers, these downturns are familiar territory. They have weathered multiple storms, including the bursting of the internet bubble in 2000, the housing collapse of 2008, and the black Monday in 1987, and earlier crises in the 1980s, such as the savings and loan crisis. What history has consistently shown is that markets eventually recover—and often with vigor. This pattern underscores the importance of patience and discipline during turbulent times. Selling out of fear can lock in losses, while staying invested allows individuals to benefit from eventual rebounds.
The Keys to Navigating Market Turmoil
We offer the following key factors to review during the current market turmoil.
1. Review and Reduce Debts If Possible
This is very important as debt burden during an economic and market downturn can force people to tap retirement savings assets (stocks and bonds) as the worst time, not to mention the emotional burdens one has to endure during such a hard time. So it possible, lighten up your debt and consider consolidate and payoff high interest debts.
2. Broad-Based Index Funds
One of the safest ways to navigate market volatility is by investing in broad-based index funds tied to diversified benchmarks like the S&P 500, Russell 2000, or total stock market indices. These funds, offered by reputable firms such as Vanguard, Fidelity, Schwab, and T. Rowe Price, provide exposure to a wide array of companies across various sectors. Historically, these funds have proven resilient, recovering from past downturns and delivering strong long-term returns. The key is ensuring that your investments are sufficiently diversified to mitigate sector-specific risks.
Many people actually invest in index funds these days in their 401(k) or other retirement savings accounts. If you are one of them, your investments in these funds are safe in the long term, regardless of what happens in a short term.
We strongly suggest that interested readers read our previous newsletter, S&P 500: A Solid ‘Business’ In A Volatile Time. This would give you a good understanding of why owning an index fund, such as the Vanguard Total Stock Market Index Fund (similar to the S&P 500 index), is basically like owning a 150-plus-year-old business that has never lost money in a single quarter in its history!
And guess what: since 1871 that has seen the Great Depression, two World Wars and many recessions, the S&P 500 index’s total return (price appreciation and dividends reinvested) has had an annualized return of 10.28%! See this SPX 500 index link for more details.
3. Actively Managed Diversified Funds
If your investments are in some actively managed stock funds that are managed by well-established fund families like Capital Group (American Funds) or Dodge & Cox, you are in good hands. These firms are known for their rigorous research and disciplined investment strategies, which aim to minimize risk while maximizing returns. These funds usually invest in solid excellent businesses that have long-term durability. While actively managed funds typically come with higher fees than index funds, their expertise in navigating market cycles can make them a worthwhile option for risk-averse investors. Further note: while in a short term, a particular fund might underperform market indexes, but as long as it invests in a diversified array of excellent solid businesses, longer terms, it will do well.
Of course, not all actively managed funds are created equal. When in doubt, switch to ultra low cost index funds.
4. Target Date Funds
For those seeking simplicity, target date funds offer a balanced mix of stocks and bonds tailored to your expected retirement year. The stock and bond portions are often index funds based. As you approach retirement, these funds automatically adjust their asset allocation to become more conservative. This feature makes them particularly suitable for long-term investors who want a hands-off approach to managing their portfolios during periods of uncertainty.
If you are investing in target date funds, stick to them during a volatile time like right now.
5. Review Sector Concentration
If your portfolio includes specialized sector funds—such as those focused on artificial intelligence (AI), semiconductors, or other high-growth industries—it’s crucial to evaluate your level of concentration. Overexposure to any single sector can amplify losses during market declines. To reduce risk, consider reallocating some of these holdings into diversified stock index funds. Doing so will help spread your investments across multiple industries and geographies, enhancing stability, while without being forced to liquidate risk assets like stocks as you are still invest the portion of capital in sector funds to stock index funds.
6. Be Prepared for Further Turbulence with Reasonable Expectations
Have Reasonable Expectations. Be Mentally Prepared for More Drawdowns: Remind yourself that the S&P 500 experienced a 56.8% drawdown from its peak in October 2007 to its lowest point in March 2009 during the 2008 financial crisis. The worst drawdown in its history occurred during the Great Depression, when the S&P 500 fell by approximately 86% from its high in September 1929 to its low in June 1932! Prepare for the long term—it might take as long as 10 years or even longer for stocks to recover to their previous highs. Finally, these are just possible scenarios; the future could be better or worse.
Finally, Don’t Panic—Stay the Course
The most important advice during market turmoil is simple: don’t panic. Emotional decision-making often leads to costly mistakes, such as selling at the bottom when prices are lowest. Instead, adopt a sound strategy based on your financial goals, risk tolerance, and time horizon. Regularly review your portfolio to ensure it aligns with your objectives, but avoid making impulsive changes driven by short-term fluctuations. Remember, markets move in cycles, and maintaining a disciplined approach is essential for long-term success. By staying the course and adhering to a systematic plan, you position yourself to emerge stronger once the storm passes.
For more information, interested readers can look at the model portfolios we offer on Brokerage Investors.
Tools & Tips: Longest S&P 500 Losses (Drawdowns)
MyPlanIQ’s SPX500 (S&P 500 Index Total Return) data series captures the longest history of the S&P 500, dating back to 1871. This is a total return index, meaning it accounts for both price appreciation and reinvested dividends. Below, we share some interesting data with our readers:
- The worst total returns of all 3-year periods: -40.2%
- The worst total returns of all 5-year periods: -17.31%
- The worst total returns of all 10-year periods: -4.02%
- The worst total returns of all 20-year periods: 2.05%
Basically, there’s no guarantee of positive returns when holding the index for fewer than 20 years—especially relevant today, given how elevated stock valuations have been.
Now, let’s take a look at the worst (or longest) drawdown periods. A drawdown period is defined here as the time between a peak and a trough—when the index falls from a recent high and eventually recovers back to that high.
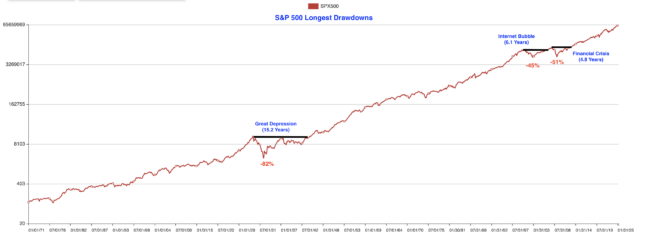
The three longest drawdown periods have the whopping drawdowns as big as -82% and as small as -50%!
These data give a sense of the worst-case scenarios that have occurred in the S&P 500’s 150-plus-year history.
Market Overview
Well, it turned out that financial markets’ weakness did develop into a somewhat full blown weakness as show in the following table shows the major asset price returns and their trend scores, as of last Friday:
| Asset Class | 1 Weeks | 4 Weeks | 13 Weeks | 26 Weeks | 52 Weeks | Trend Score |
|---|---|---|---|---|---|---|
| US Stocks | -9.8% | -9.8% | -15.0% | -10.6% | -1.5% | -9.3% |
| Foreign Stocks | -9.5% | -9.9% | -5.6% | -12.8% | -5.7% | -8.7% |
| US REITs | -9.5% | -10.4% | -7.1% | -13.1% | -1.5% | -8.3% |
| Emerging Market Stocks | -9.0% | -8.3% | -7.1% | -16.3% | -2.8% | -8.7% |
| Bonds | -0.3% | -0.4% | 1.7% | -0.6% | 4.3% | 0.9% |
More detailed returns and trend scores can be found on MyPlanIQ.com Market Overview.
As stated above, we call for staying the course.
Struggle to Find Your Old Retirement Accounts?
Find Tools and Calculators That Provide Quick Help